
Live Textile Prices in Excel
Pull any EmergingTextiles data table into Excel in three clicks. No coding.
An API endpoint is like a bookmark that delivers data instead of a web page. Once Excel knows the URL, it can fetch fresh prices on demand, no more visits to the site, no more downloads, no more copy-paste.
If you already use Excel for your market analysis, you can replace the copy-paste routine with a live connection to our data. Open your file, click refresh, and the latest prices appear. Here is how.
Three Steps
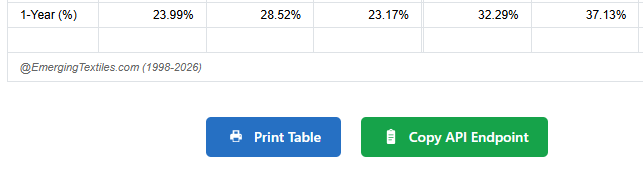
Navigate to any price table on EmergingTextiles.com (cotton futures, polyester prices, yarn prices, apparel imports, and so on). Below the table you will see a green button. Click it.
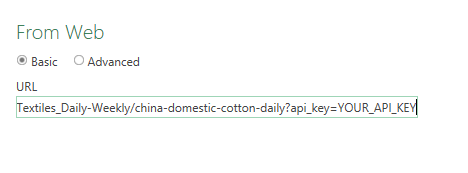
The button copies a URL like the one below to your clipboard. Before pasting it into Excel, replace the yellow-highlighted text with your personal API key (you received it when your subscription was activated).
In Excel, go to the Data tab and click From Web. Paste the URL you just copied, and click OK. Excel will fetch the data and show a preview.
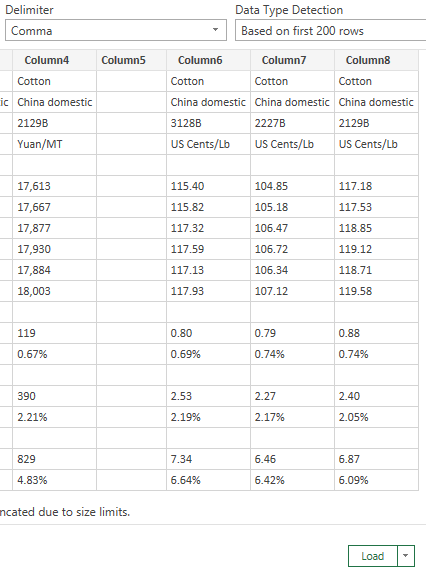
Excel shows a preview with the comma delimiter already detected and the columns correctly split. Click Load. The data drops into your worksheet as a clean Excel table, ready for charts, formulas, or pivot tables.
From now on, whenever you want the latest data, right-click the table and select Refresh. Your file pulls the newest prices from our server.
Common Questions
=IMPORTDATA("YOUR_URL"). For advanced options (scheduled refresh, filtering, multi-sheet dashboards), see our full API documentation.